The savings begin only when the measurement changes a load schedule, exposes a failing appliance, or eliminates consumption that nobody knew existed.
The potential is real but bounded. Research compiled by the American Council for an Energy-Efficient Economy indicates that real-time electricity feedback can reduce household electricity use by roughly 5% to 15% compared with standard monthly billing. Separate UK analysis found more modest baseline savings after smart-meter and in-home-display deployment: about 3.0% for electricity and 2.2% for gas. The gap is not a contradiction. It reflects the difference between seeing data and acting on it.
For homeowners, the practical question is not whether a real-time electricity usage monitor produces an attractive graph. It is whether the graph leads to a repeatable operating change.
The reality of real-time feedback: data is not a control system
Monthly billing is too slow for diagnosis. It tells a household how much electricity it consumed, but not which circuit caused the increase, when the load appeared, or whether the rise came from deliberate use or equipment degradation.
A smart home energy monitor compresses that delay from weeks to seconds. Depending on the hardware, it can show:
- Current whole-home demand in watts or kilowatts.
- Consumption by individual circuits.
- Historical load profiles by hour, day, or month.
- Sudden spikes associated with heating, cooling, pumps, or electric cooking.
- Persistent low-level demand from standby electronics.
- Changes in appliance behavior over time.
That last category is where the system becomes more than a dashboard. A refrigerator compressor that begins running longer, a heat-pump system with a declining coefficient of performance, or a pump motor that cycles abnormally can alter the household load curve before the fault becomes obvious.
The monitor creates visibility. It does not create discipline, automation, or a favorable tariff. Those must come from the household and the electrical system.
The monitor is a measurement instrument, not an efficiency project. Savings begin when the load profile produces a decision.
The 5% to 15% reduction often associated with real-time feedback should therefore be treated as an operating range, not a guaranteed return. A household with high discretionary consumption, electric heating, a poorly managed water heater, or multiple always-on devices has more waste available to remove. A small, efficient home with stable baseload has less.
Baseline usage matters. So does the tariff. A household on a flat electricity rate can reduce total consumption, but it cannot create time-of-use savings by moving laundry from one hour to another. A household on a time-of-use plan can gain from load shifting even when total kilowatt-hours change very little.
The same data can produce very different financial outcomes.
Hardware choices: CT clamps versus AI load disaggregation
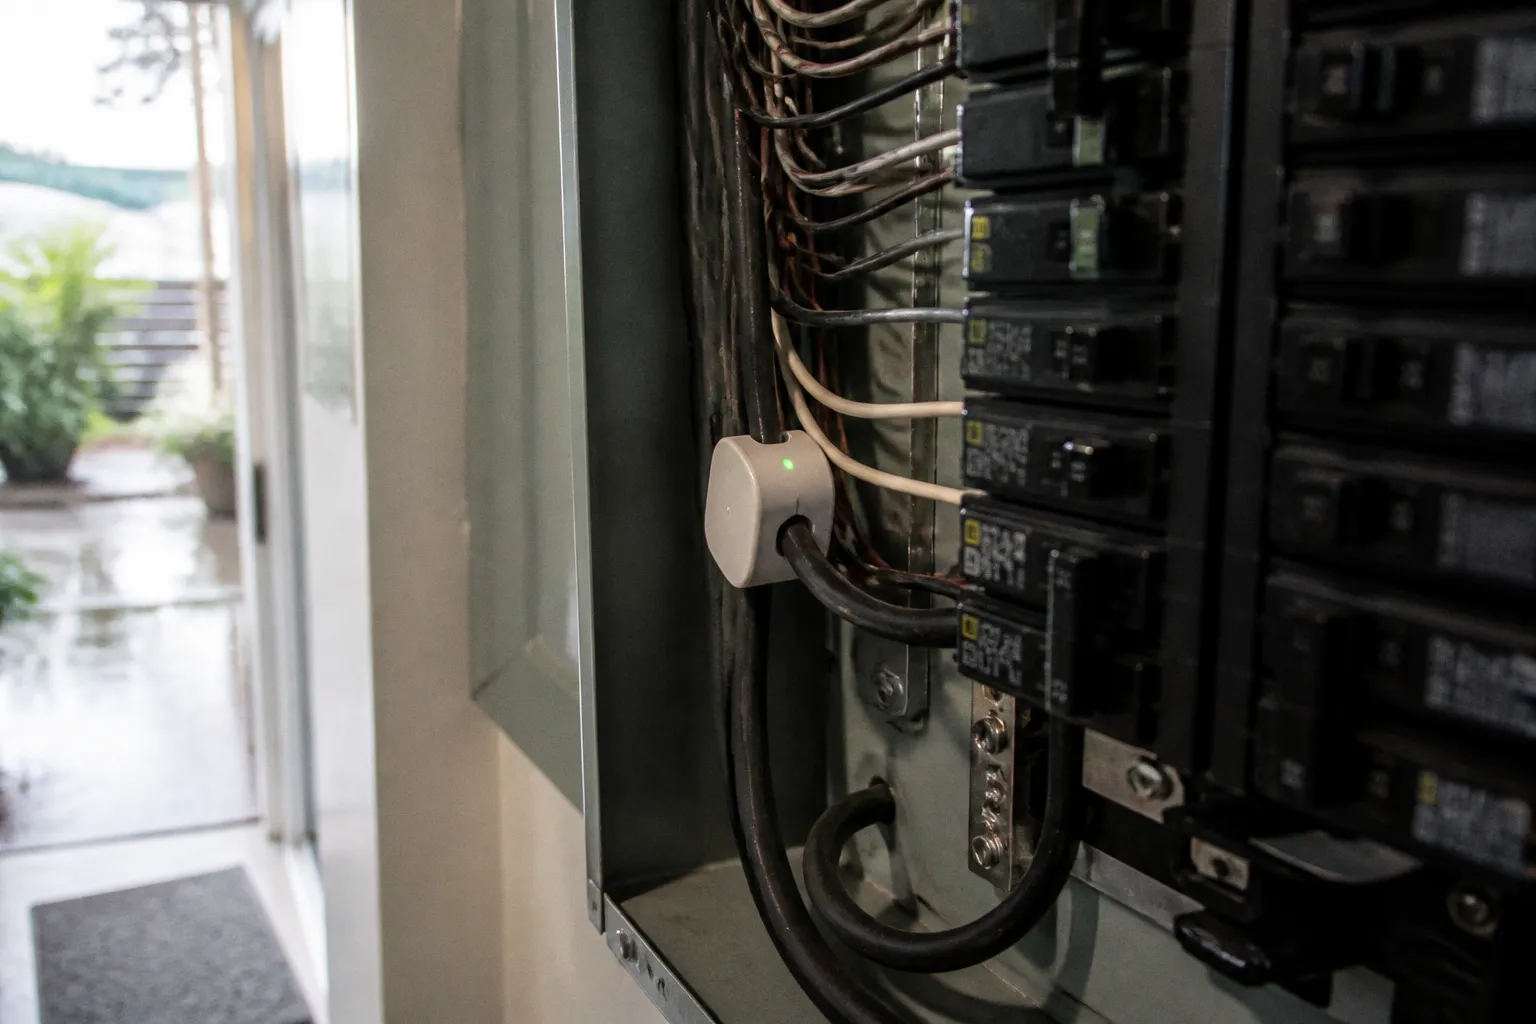
The main technical distinction in the home energy monitor market is how the system identifies loads. Some devices measure circuits directly with current-transformer clamps. Others measure the total mains feed and use software to infer which appliances are operating.
Neither approach is universally superior. They solve different measurement problems.
| Parameter | CT-clamp monitoring | AI-driven load disaggregation |
|---|---|---|
| Measurement method | Direct current measurement on the main feed or individual circuits | Total mains measurement interpreted by machine-learning software |
| Circuit visibility | High when clamps are installed on the relevant breakers | Inferred at appliance level; accuracy depends on device signatures |
| Installation burden | Requires access to the electrical panel and correct clamp placement | Usually simpler hardware installation, but software may need a learning period |
| Best use case | Large loads, dedicated circuits, solar, HVAC, water heating | General appliance discovery without wiring every circuit |
| Main limitation | Limited by the number and placement of clamps | Cannot identify every appliance instantly or perfectly |
| Example configuration | Systems such as Emporia Vue can monitor up to 16 individual circuits with CT clamps | Systems such as Sense infer loads from whole-home electrical patterns |
A CT clamp is a direct sensor. It detects current flowing through a conductor without becoming part of the circuit. When a clamp is placed on a dedicated water-heater circuit, the monitor has a comparatively clean signal. The same is true for an air-conditioning compressor, an electric vehicle charger, or a heat-pump circuit.
This directness improves attribution. If the circuit consumes 4 kilowatts during a defined period, the system does not need to guess which appliance generated the load. The trade-off is installation complexity and panel capacity. A homeowner may need an electrician, particularly where the panel is crowded, the service configuration is unusual, or the installation involves split-phase measurement and additional circuits.
AI-driven systems take a different path. They examine the electrical signature of the home as a whole. A refrigerator, kettle, washing machine, and HVAC compressor produce different combinations of startup current, running demand, cycling frequency, and duration. Software attempts to separate these patterns.
That can be useful. It can also be imprecise.
Appliance recognition is not a binary event. Some loads are electrically distinctive. Others overlap. Two resistive heaters may look similar. Several devices operating at the same time can produce a composite signature that the software must untangle. Recognition may require manual labeling and a learning period. A system that identifies the major loads correctly can still misclassify small devices or aggregate several loads under one category.
The distinction between a smart electrical panel and an energy monitor is also material. A monitor observes and reports. A smart panel can add circuit-level switching, load management, and sometimes automated control. The panel is a larger capex decision. It may coordinate backup power, electric vehicle charging, battery storage, or high-demand appliances. It may also require a full panel replacement rather than a sensor installation.
For a household seeking information and behavioral savings, a monitor is usually the lower-risk entry point. A smart panel becomes more rational when the home already has constrained service capacity, solar and storage, an EV charger, electric heating, or a need for automatic load prioritization.
Accuracy is a system property, not a marketing number
The question of home energy tracker accuracy is often framed too narrowly. A monitor can be accurate at measuring total current and still be weak at explaining which appliance consumed it.
There are at least four layers of accuracy:
1. Electrical measurement accuracy.
The sensors must capture voltage, current, phase relationships, and power correctly. Clamp placement, orientation, calibration, and the electrical architecture of the home all matter.
2. Circuit attribution.
A direct clamp on a dedicated circuit can produce a clear reading. A shared circuit creates a more complicated interpretation. If a refrigerator, microwave, and countertop equipment share one circuit, the monitor may report the circuit accurately without separating each device.
3. Device recognition.
AI systems infer appliance activity from patterns. Their results improve when the load has a distinctive signature and when the system has enough operating history.
4. Financial translation.
The bill depends on the utility tariff, fixed charges, demand charges where applicable, taxes, and time-of-use periods. A perfectly measured kilowatt-hour does not automatically translate into a perfectly predicted bill.
For operational decisions, the monitor does not need laboratory-grade precision on every small device. It needs enough signal to rank the loads correctly. If the data shows that a water heater, HVAC system, or vehicle charger dominates the evening peak, the household can act even if minor standby loads remain uncertain.
This is the proper standard: actionable resolution.
A monitor that reports every device with false confidence can be less useful than one that clearly identifies only the major loads. The objective is not a beautiful taxonomy of household electronics. It is a defensible answer to three questions:
- Which loads dominate total consumption?
- Which loads create expensive peaks?
- Which loads are changing in a way that suggests waste or equipment problems?
Finding energy vampires and failing motors
Standby consumption is often discussed as if every plugged-in device were a major financial liability. That is not how the load profile usually works. Some electronics draw very little power. Others maintain network connections, power adapters, displays, or charging circuits continuously. The monitor’s value is that it replaces assumptions with a measured baseline.
Start with the overnight curve.
When the home is quiet, the remaining demand is the baseload. It includes refrigeration, networking equipment, security systems, ventilation, heating controls, pumps, chargers, and standby electronics. A flat overnight profile is not automatically waste. A sudden increase at a particular hour is more informative. So is a baseline that rises after a new device is installed.
The practical method is comparative:
1. Observe the overnight load under normal conditions.
2. Turn off or unplug one category of equipment.
3. Watch whether the baseline changes.
4. Repeat with larger groups of devices rather than chasing every small adapter.
5. Record the recurring loads that remain after the obvious sources are removed.
This approach prevents a common error: spending time on low-power electronics while ignoring a high-demand appliance that runs for hours.
Motors deserve particular attention. Refrigerators, freezers, ventilation fans, pool pumps, well pumps, and HVAC systems do not consume a constant amount of electricity. Their operating duration and cycling behavior are part of the cost.
A refrigerator with a compressor that runs longer than usual may be dealing with a failing seal, dirty condenser, poor airflow, or internal mechanical wear. A pump that cycles more frequently can indicate a control or pressure problem. An HVAC system that reaches a higher peak and runs through longer cycles may reflect filter restriction, duct losses, refrigerant problems, or changing outdoor conditions.
The monitor does not diagnose the fault. It identifies a pattern worth investigating.
That distinction protects against overinterpretation. A single spike is not proof of a defective motor. Weather, occupancy, cooking, hot-water demand, and defrost cycles can all alter consumption. The useful signal is persistence: the same load becomes larger, longer, or more frequent under comparable conditions.
Strategic load shifting: use the tariff, not just the dashboard
Reducing household carbon footprint with smart tech is often presented as a matter of consuming less. At the grid level, timing also matters. Electricity produced and delivered at one hour may have a different operational and financial profile than electricity consumed at another.
A monitor can expose the household’s peaks. It cannot change them without an operating rule.
For a time-of-use tariff, the first targets are flexible loads:
- Water heating, where the system allows safe scheduling.
- Laundry and dishwashing.
- Electric vehicle charging.
- Battery charging.
- Pool and circulation pumps.
- Thermal preheating or precooling, where equipment controls support it.
The financial case depends on the rate structure. Moving a load from an expensive period to a cheaper one can lower the bill even if the total kilowatt-hours remain flat. Moving it to an off-peak period that is not actually cheaper produces no economic benefit. A dashboard without the tariff layered onto it is incomplete.
Load shifting also has a technical limit. Not every household can move demand freely. Cooking follows occupancy. Heating and cooling respond to weather. Medical equipment may need continuous operation. Water-heater controls may be restricted by hygiene, comfort, or manufacturer requirements.
The best strategy is not to optimize every appliance. It is to identify the few controllable loads that coincide with the household’s largest cost windows.
This is where automation improves the economics. Manual behavior changes are fragile. A homeowner may remember to delay EV charging for a week and then revert to default settings. A scheduled charger, heat-pump controller, or smart relay can preserve the change without relying on daily attention.
However, automation introduces its own requirements. The device must be compatible with the appliance, the control logic must respect safety limits, and the household must retain an override. A low bill achieved by creating operational inconvenience is not a durable efficiency gain.
Turning tomorrow’s data into a working operating plan
The first day with a monitor often produces too much information. The application may display dozens of circuits, estimated appliance categories, hourly bars, and live wattage. None of that tells the homeowner what to do next.
A more disciplined sequence is to establish the system’s hierarchy.
1. Find the baseload
Look at a quiet period when heating, cooling, cooking, laundry, and charging are inactive. This reveals the demand the home carries continuously.
The purpose is not to force the baseload to zero. Some equipment must remain energized. The purpose is to find unexplained changes and large always-on consumers. Networking infrastructure, refrigeration, pumps, and security systems have different operational requirements from entertainment devices or decorative lighting.
2. Rank loads by energy, not annoyance
A device that is visibly active is not necessarily expensive. A high-wattage load that operates briefly may use less energy than a moderate load that runs continuously.
Energy is power multiplied by time. The monitor should therefore be read in both watts and kilowatt-hours. A 1.5-kilowatt appliance operating for 20 minutes has a different impact from a 200-watt device operating all day. The second load may be harder to notice but more significant over a month.
Rank the loads by recurring contribution. Start with the largest controllable source.
3. Separate fixed, flexible, and faulty demand
Fixed demand cannot easily move or disappear. Flexible demand can be rescheduled. Faulty demand requires maintenance rather than a behavioral adjustment.
This classification is more useful than a generic list of appliances. It prevents the household from trying to solve an equipment problem by changing habits, or attempting to shift a load that has no meaningful scheduling flexibility.
4. Test one change at a time
If the household changes thermostat settings, charging schedules, laundry timing, and standby equipment simultaneously, the resulting data becomes difficult to interpret.
A controlled comparison does not require a laboratory. It requires consistency. Compare similar days, similar weather, and similar occupancy where possible. Look for a repeated change in the load curve rather than a single favorable bill.
5. Convert the winning change into a default
The final step is operational. Adjust the appliance schedule, timer, thermostat rule, charger setting, or power-management routine so the improved behavior becomes automatic.
Without this step, the monitor remains an information product. With it, the monitor becomes part of the household’s energy-control strategy.
What the savings numbers actually mean
The widely cited 5% to 15% electricity reduction is useful as a scale indicator. It should not be treated as a promise attached to a particular device.
Several factors determine the result:
- The home’s starting consumption and existing efficiency.
- The share of demand that is visible and controllable.
- Whether electricity pricing varies by time.
- The presence of electric heating, cooling, water heating, or vehicle charging.
- Whether the household acts on the data consistently.
- Whether the monitor is used for one week or integrated into long-term routines.
The Behavioural Insights Team’s estimate of 3.0% electricity savings and 2.2% gas savings from smart-meter feedback illustrates the lower end of the behavioral effect. Feedback can change habits, but the effect is not unlimited and may be smaller when the household has little discretionary demand.
Vendor-reported results can be higher. Emporia has reported average monthly electricity savings of 10% or more among users of its Vue Home Energy Monitor. That figure is useful as a product claim and a sign of potential, but it is not a universal household benchmark. Users who adopt a monitor because they suspect waste may have more savings available than households with already optimized consumption.
The financial calculation must also use the household’s own tariff. A small percentage reduction on a low electricity bill produces a small absolute return. A larger home with electric heating and high seasonal demand may have a stronger case, especially if the monitor exposes a major load that can be scheduled or repaired.
Hardware cost, electrician fees, subscription charges, and replacement cycles belong in the capex calculation. The payback period is not determined by the monitor’s advertised accuracy alone.
The long-term problem: attention decays
The strongest savings often appear after the first discovery phase. The monitor identifies a wasteful load, the homeowner changes its schedule, and the monthly bill improves. Then attention moves elsewhere.
This is a predictable failure mode. A dashboard that requires constant interpretation has a high operating cost in human attention. Over time, notifications become background noise. Appliance labels remain unreviewed. Historical data accumulates without producing decisions.
Long-term value depends on reducing that friction.
Useful functions include:
- Alerts for abnormal increases in overnight baseload.
- Notifications when a major appliance runs outside its normal schedule.
- Tariff-aware estimates rather than raw consumption alone.
- Integration with chargers, thermostats, batteries, or smart relays.
- Monthly comparisons adjusted for weather and occupancy where possible.
- Circuit-level visibility for the loads that actually matter.
The system should also be revisited when the home changes. New HVAC equipment, an EV, solar panels, battery storage, a heat pump, or a home office can materially alter the load profile. The monitor’s old categories and thresholds may no longer describe the operating reality.
At that point, the technology moves closer to energy management than passive monitoring. The distinction matters. Passive monitoring tells the homeowner what happened. Energy management applies rules to what happens next.
A useful monitor should reduce uncertainty around the largest loads. If it only produces more charts, it has increased information, not efficiency.
Commercial viability: strong as a diagnostic layer, limited as a standalone product
Smart energy monitors have a clear role in residential electrification. They can expose baseload, identify large circuits, support tariff-aware scheduling, and reveal changes in equipment behavior. They are especially useful in homes with complex electrical loads, variable tariffs, EV charging, electric heating, or solar and storage.
The weaker case is a device purchased as a one-time behavioral prompt with no plan for follow-through. Real-time feedback can produce measurable reductions, but the savings depend on the quality of the intervention. Installing the hardware is the easy part. Selecting the right load, changing its operation, and maintaining the change determine the return.
CT-clamp systems offer stronger direct measurement where circuit detail matters. AI-based disaggregation reduces installation complexity and can provide a broad appliance map, but its recognition layer is inferential. A smart electrical panel adds control and capacity management, but its higher capex requires a larger electrical use case.
The sober assessment is straightforward. A smart home energy monitor can support meaningful electricity savings, commonly within the broad 5% to 15% range identified in energy-efficiency research, but only when the data is converted into operating decisions. The most credible value is not the promise of effortless savings. It is the ability to find the few loads that dominate the bill and make their behavior visible enough to change.
That is a practical proposition. It is also the limit of the technology.