It is a disturbance moving through a linked system of surface flow, deep-water formation, atmospheric exchange, sea ice, freshwater discharge, and planetary heat storage.
The most visible signal is not necessarily found where the circulation does its deepest work. In the subpolar North Atlantic, a persistent region of comparatively cool sea-surface temperatures—the so-called warming hole—has become one of the key AMOC slowdown indicators in climate modeling. Farther south, at 26.5°N, an observing array tracks the transport of heat and water through the Atlantic. Between those points lies the mechanism itself: warm, salty water moving north, losing heat, becoming denser, and sinking into the deep ocean.
The circulation will very likely weaken during the 21st century under all major emissions scenarios assessed by the IPCC. The unresolved question is not whether the system is under pressure. It is how the pressure propagates through the ocean, how much weakening is already underway, and whether a gradual decline can become a self-reinforcing transition.
Thermohaline dynamics: the engine of the Atlantic conveyor
The AMOC is often described as an ocean conveyor belt, a useful phrase so long as it does not suggest a simple mechanical loop. The circulation is driven by differences in density. Those differences arise mainly from temperature and salinity—hence the term thermohaline, combining heat and salt.
At the surface, warm Atlantic water moves northward. The current carries heat from lower latitudes toward the subpolar basins around Greenland, Iceland, and the Nordic Seas. As the water releases heat to the atmosphere, it cools. In places where evaporation and sea-ice formation increase salinity, the surface water becomes denser still. Dense water sinks, feeding southward-flowing currents at depth. The return flow eventually rises through mixing and upwelling, completing a circulation pattern that connects the surface and abyss.
A single parcel of ocean water may take an estimated 1,000 years to complete a full global conveyor circulation cycle. That timescale matters. The ocean is not responding to greenhouse-gas forcing like a thin atmospheric layer that can warm within decades. It absorbs and redistributes heat through a vast, stratified volume. A change at the surface can therefore leave a signature far from its origin and persist across generations.
The AMOC also should not be confused with the Gulf Stream as a whole. The Gulf Stream is a powerful western boundary current, shaped strongly by wind and the rotation of the Earth. The AMOC includes the broader northward movement of warm water and the compensating deep return flow. A slowdown in the overturning circulation does not mean that the Gulf Stream simply stops or disappears from the map.
What changes first is the balance of transport and sinking. Less dense water reaches the threshold required for deep-water formation, or it reaches that threshold less frequently and in a smaller area. The resulting circulation can weaken even while surface currents remain energetic.
AMOC slowdown is a density problem before it is a current-speed problem: change the temperature or salt balance, and the architecture of the circulation begins to shift.
This is why the physics of AMOC cannot be reduced to one measurement. Current velocity, temperature, salinity, sea level, wind stress, and surface buoyancy fluxes all describe different parts of the same system. The challenge is to separate a long-term change from the ocean’s substantial natural variability.
Freshwater forcing and the mechanics of deep-water formation
The most direct threat to North Atlantic overturning is freshening. Freshwater is less dense than seawater. When additional freshwater reaches the surface of the subpolar North Atlantic, it lowers salinity and can make the upper ocean more buoyant.
That freshwater has several possible sources:
- melting ice sheets and glaciers, especially the Greenland Ice Sheet;
- increased runoff from land under a warmer and wetter climate;
- changes in precipitation over the North Atlantic;
- meltwater and altered circulation around the Arctic;
- reduced sea-ice formation, which changes the seasonal release of salt into surrounding seawater.
The physical sequence is straightforward, but its regional expression is not.
Warm, saline water flowing north carries density into the subpolar basins. Surface cooling should increase density further, allowing the water to sink. Freshwater interrupts that process. The surface layer becomes more stable relative to the colder, denser water below. Stratification strengthens, vertical exchange weakens, and the formation of deep water can slow.
This does not require the North Atlantic to become uniformly fresh. Ocean circulation is governed by gradients and thresholds. A relatively thin, low-salinity surface layer can affect the depth to which winter mixing penetrates. If the mixed layer does not reach dense water beneath it, the volume of water entering the deep return flow declines.
The consequences extend beyond the sinking regions. A weaker AMOC transports less heat northward. That can cool portions of the subpolar North Atlantic even as the planet continues to warm overall. It can also alter the position and intensity of atmospheric circulation, shift rainfall patterns, influence European climate, and affect sea level along parts of the North American coast. These effects are not independent outcomes stamped onto a map. They are linked responses to changes in heat and mass transport.
The word freshwater can make the process sound benign. In the ocean, it is not the volume alone that matters but where it arrives, when it arrives, and how effectively winds and eddies mix it downward. A pulse spread across a large area may have a different impact from the same amount concentrated in a deep-water formation region.
The same applies to warming. Warmer surface water is generally less dense than colder water. Ocean warming therefore works alongside freshening to increase surface buoyancy. Both pressures make it harder for the upper ocean to lose enough density during winter to sink deeply.
Why surface buoyancy fluxes matter
Climate models track these mechanisms through surface buoyancy fluxes. The term refers to the combined influence of heat and freshwater exchange at the ocean surface on seawater density.
Cooling and evaporation tend to increase surface density. Heating and precipitation tend to decrease it. Sea-ice formation removes freshwater from the ocean as ice and leaves salt behind in the surrounding seawater, raising salinity. Ice melt has the opposite effect.
The balance varies seasonally and geographically. A model may therefore reproduce the broad AMOC response while still differing in the location, timing, or intensity of deep convection. That is one reason projections are expressed as ranges rather than as a single countdown to failure.
Decoding the warming hole
The subpolar North Atlantic warming hole is an area where sea-surface temperatures have not risen as quickly as the global ocean average and may show a relative cooling signal. It is one of the most discussed AMOC slowdown indicators in climate modeling, but it is not a standalone diagnosis.
The region sits downstream of the circulation’s northern heat transport. If the AMOC weakens, less warm water may be carried northward into the subpolar basins. A cooling or muted-warming signature can emerge even while greenhouse forcing raises temperatures across the wider ocean.
The spatial pattern is important. Scientists are not looking for any patch of cold water and labeling it an AMOC signal. They examine the location, persistence, depth structure, seasonal behavior, and relationship to other variables. Sea-surface temperature anomalies are compared with salinity, density, current transport, atmospheric forcing, and model simulations.
The warming hole can also be influenced by factors that are not direct measures of overturning strength. Aerosols, wind patterns, air-sea heat exchange, ocean eddies, and internal variability can all shape the surface temperature field. A cold anomaly may be compatible with AMOC weakening without proving that the circulation has crossed a tipping threshold.
That distinction is essential. The ocean does not provide a single warning light. It provides overlapping signals, each with a different degree of reliability and a different relationship to the underlying physics.
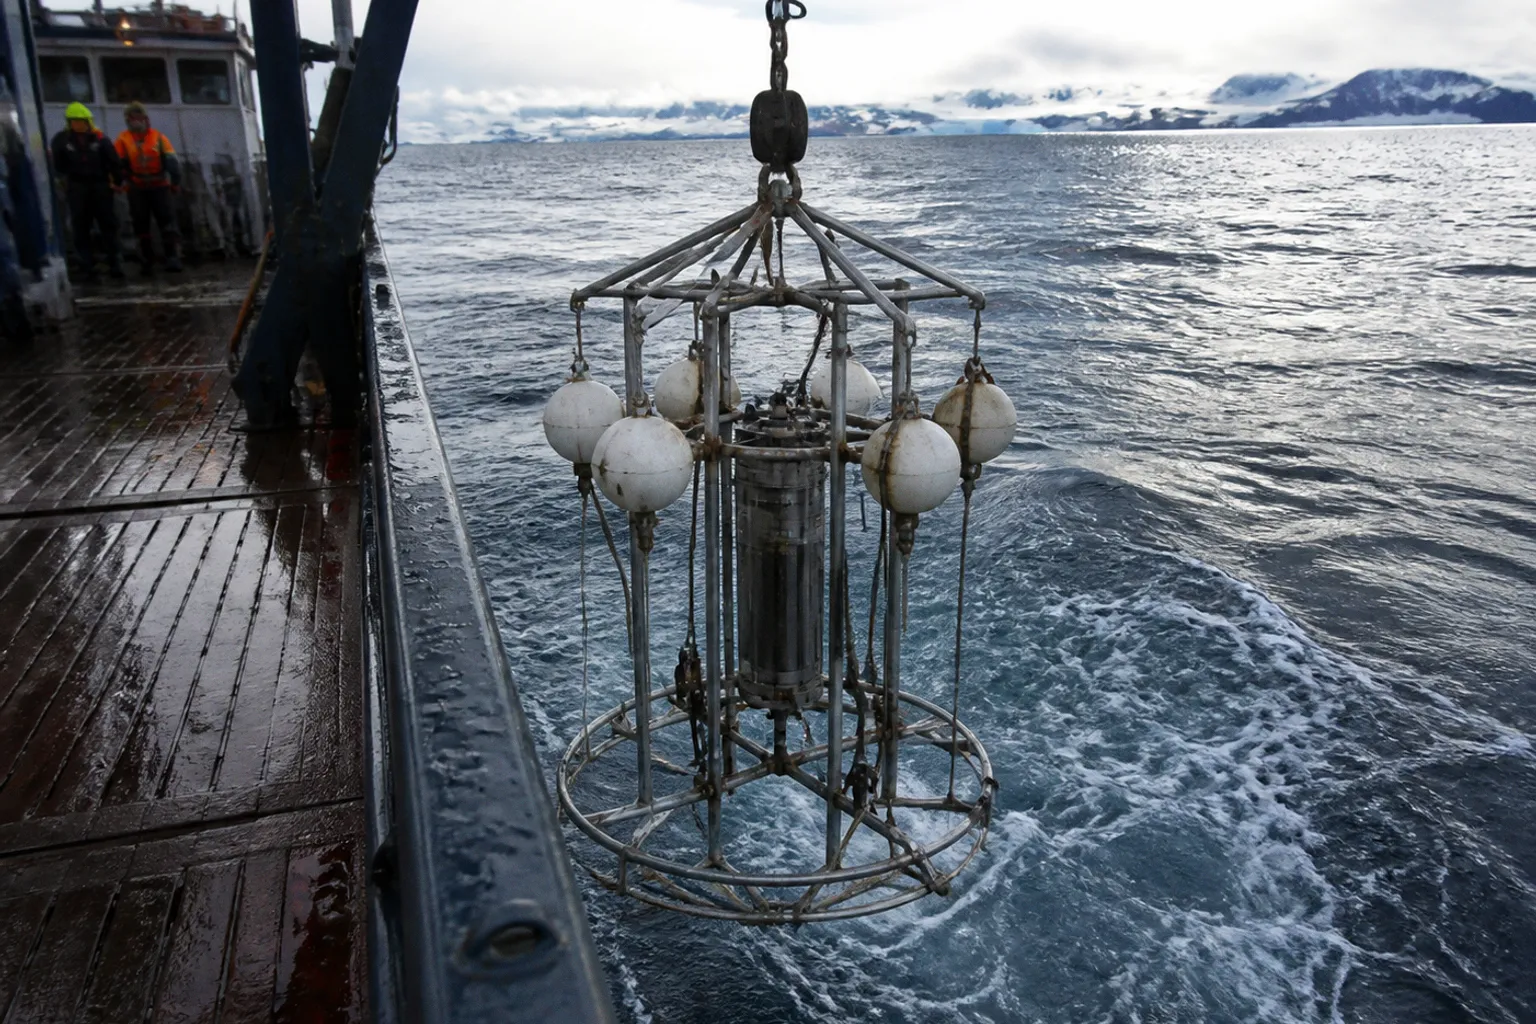
At 26.5°N, the RAPID observing array measures the Atlantic circulation using a combination of instruments that capture transport across the basin. This latitude is far south of the main deep-water formation zones, but it is strategically placed to measure the integrated movement of water and heat. Long-term observations at this kind of location are necessary because the AMOC varies naturally on seasonal, interannual, and multidecadal timescales.
A model projection that shows a declining trend must be tested against this variability. So must a period of apparent strengthening. Short records can be dominated by circulation swings that do not represent the long-term forced response.
The indicators researchers read together
The most useful AMOC slowdown indicators climate modeling provides are not isolated fingerprints but converging lines of evidence:
1. Subpolar North Atlantic sea-surface temperature patterns. The warming hole can indicate reduced northward heat transport, particularly when its location and evolution match simulated AMOC changes.
2. Surface buoyancy fluxes. Cooling, evaporation, precipitation, runoff, and ice processes determine whether surface water becomes dense enough to sink.
3. Deep-water formation and mixed-layer depth. Reduced winter mixing or shallower convection can reveal a weakening of the density-driven engine.
4. Salinity and temperature at depth. These measurements show whether changes are confined to the surface or are penetrating into the water masses that carry the return flow.
5. Transport observations across the Atlantic. Arrays such as RAPID provide direct constraints on the strength and variability of the circulation at a fixed latitude.
6. Sea-level and atmospheric responses. A weaker AMOC can redistribute water and heat in ways that affect regional sea level and atmospheric circulation, although these signals are shaped by many other processes as well.
No single indicator settles the question. The strength of the evidence comes from the physical relationship among them.
What climate models project through 2100
The IPCC’s Sixth Assessment Report concluded that the AMOC is very likely to decline over the 21st century across the assessed emissions scenarios. This is a robust direction of change, not a precise prediction of one future current speed.
The magnitude is less certain. Climate models differ in how they represent deep convection, freshwater transport, ocean mixing, atmospheric feedbacks, and mesoscale eddies. Model resolution matters because eddies can transport heat and salt across fronts in ways that are difficult to capture directly at coarse scales.
A research analysis combining real-world ocean observations with climate models constrained the projected slowdown, estimating a decline of roughly 42% to 58% by 2100 across the evaluated model spread. Such a range should not be read as a timetable. It describes the scale of weakening produced when observations are used to narrow the behavior of the models.
The distinction between slowdown and collapse is not semantic. A circulation can weaken substantially while continuing to overturn. Collapse would imply a much more abrupt and self-reinforcing transition, with deep-water formation becoming severely disrupted over a sustained period. The exact threshold for such a shift is not established, and no immediate collapse date is proven across the scientific consensus.
A useful comparison is the difference between the direction and the endpoint of a river. The direction of flow may be clear while the exact point at which channels divide remains uncertain. In the AMOC, greenhouse warming and freshwater input push the density balance toward weaker overturning. The nonlinear response near a tipping point is harder to locate.
| Question | What is relatively well established | What remains uncertain |
|---|---|---|
| Direction of change | The AMOC will very likely weaken during the 21st century | The exact pace of weakening in any given decade |
| Main physical pressure | Warming and freshwater input reduce surface density in key regions | The regional balance between freshwater sources, mixing, and atmospheric forcing |
| Surface signal | The subpolar North Atlantic warming hole is consistent with altered heat transport | How much of the anomaly comes from AMOC change versus aerosols and natural variability |
| Observational constraint | Transport arrays and ocean measurements can test model behavior | Records remain short relative to multidecadal and centennial variability |
| End-state | A slower circulation is physically plausible under continued warming | The threshold and timing of an irreversible collapse are unknown |
| Projection to 2100 | Model-observation analyses estimate substantial weakening | The contribution of unresolved eddies and feedback loops to the final range |
The low-emissions future is not equivalent to an unchanged AMOC. Even under lower forcing, the system carries thermal and hydrological inertia. But emissions trajectories still matter because they control the magnitude of warming, the rate of ice loss, and the accumulation of freshwater stress. The difference between scenarios is not whether the ocean responds; it is how far the response proceeds.
The tipping point problem
The phrase AMOC tipping point has entered climate reporting because the circulation may contain feedbacks capable of amplifying an initial slowdown. The basic mechanism is often described as follows: a weaker overturning brings less salty water northward, the subpolar surface becomes fresher, deep-water formation weakens further, and the circulation declines again.
That feedback is physically credible. It is also not the only process at work.
Atmospheric circulation can change the delivery of heat and moisture to the North Atlantic. Wind-driven gyres can redistribute salinity. Ocean eddies can transport water across fronts and alter local density. Sea ice can change the exchange of heat and freshwater. The atmosphere and ocean respond on different timescales, and their interaction can either reinforce or moderate a circulation anomaly.
This is where model structure becomes consequential. Mesoscale eddies are smaller than the grid spacing of many global climate models. They are represented through parameterizations—mathematical approximations of their average effects. Those approximations can influence the modeled transport of heat and salt, especially around strong fronts and deep-water formation zones.
The precise contribution of sub-grid eddies relative to atmospheric feedback loops remains an active research question. So does the role of natural multidecadal variability. A model may simulate a rapid decline because its internal variability happens to align with external forcing. Another may produce a more gradual response. Neither difference automatically invalidates the broader result that warming weakens the circulation.
Collapse is not a switch on a dashboard
The most damaging misunderstanding is to treat an uncertain tipping point as either imminent or irrelevant. Both conclusions outrun the evidence.
There is no confirmed calendar year at which the AMOC must collapse. There is also no scientific basis for assuming that a system exposed to sustained warming and freshwater forcing will weaken harmlessly without limit. The responsible interpretation lies between those positions: the circulation is a large, slow, nonlinear climate system, and its risk profile worsens as forcing increases.
An abrupt transition would matter because it could reorganize climate conditions across the North Atlantic region faster than societies and ecosystems can adapt. But gradual weakening has consequences too. Changes in seasonal heat transport, storm tracks, rainfall, marine productivity, sea level, and polar conditions can accumulate without a dramatic moment of failure.
For coastal wetlands, estuaries, fisheries, and high-latitude ecosystems, a persistent alteration in temperature and salinity may be more important than whether the circulation is described as having crossed a formal tipping threshold. Ecological systems respond to the conditions they receive, not to the label attached to the ocean model.
Reading the ocean without forcing certainty
The AMOC is difficult to observe because it is immense, deep, and variable. Direct monitoring began only recently compared with the circulation’s timescale. Scientists therefore combine several forms of evidence:
- modern observations from moorings, floats, satellites, and research cruises;
- oceanographic reconstructions based on sediment and other proxy records;
- process-based climate models;
- statistical methods that compare observed variability with simulated circulation states;
- physical indicators such as salinity, temperature, density, sea level, and surface heat exchange.
Historical evidence provides longer context but less direct resolution. Instrumental observations provide more detailed measurements but cover a shorter interval. Models can extend the system into possible futures but are limited by resolution, parameterization, and assumptions about emissions and ice-sheet behavior.
The result is not a single clean trend line. It is a constrained picture with areas of confidence and areas of active investigation.
The broad mechanics are clear: the AMOC depends on temperature and salinity gradients; warming reduces density at the surface; freshwater inputs reduce salinity; and both effects can inhibit deep-water formation. The projected direction is also clear enough for the IPCC to describe a 21st-century decline as very likely.
What is less clear is the timing and shape of the response. The exact collapse threshold remains unknown. The relative contribution of eddies, atmospheric feedbacks, ice processes, and natural variability remains under study. Surface temperature fingerprints cannot serve as sole proof of collapse, especially when the record is short and the climate system is noisy.
That uncertainty should improve the quality of decision-making, not paralyze it. Climate policy rarely operates with perfect forecasts. It operates under risk, with irreversible or expensive outcomes carrying greater weight than a narrow range of benign possibilities.
The wider climate implication
The Atlantic overturning circulation is a local physical system with global reach. Its northward heat transport influences the climate of the North Atlantic basin, but its behavior is also a response to global warming, ice loss, precipitation change, and ocean heat uptake. The circulation is therefore both a victim of climate change and a potential amplifier of regional disruption.
The ocean’s apparent slowness can be misleading. A parcel of water may take centuries to complete the global circuit, but the density conditions that govern sinking can change within seasons. A layer of freshwater at the surface, a sequence of unusually warm winters, or altered atmospheric transport can modify deep-water formation before the full consequences are visible in the deep ocean.
That is why the central question is not whether a dramatic collapse headline can be attached to a particular year. It is whether human emissions are moving the Atlantic toward a less stable circulation state—and whether monitoring and policy are keeping pace with that movement.
At the subpolar North Atlantic, the signal is written in gradients: cooler surface water beside warmer regions, freshening above saltier layers, altered mixing above deep reservoirs. At 26.5°N, instruments measure the integrated transport. In climate models, those observations become constraints on possible futures. Across the system, the same physical fact persists: add heat and freshwater to the surface, and the ocean must work harder to make dense water sink.
The AMOC has not been shown to have collapsed. Its exact tipping point remains unknown. But a weakening circulation is not an abstract model artifact. It is a measurable change in the distribution of heat, salt, and density—the basic materials from which North Atlantic climate is built. The broader implication is sober: reducing emissions does not merely lower future air temperatures. It also reduces the freshwater and thermal pressures that are reshaping one of the planet’s largest climate regulators.