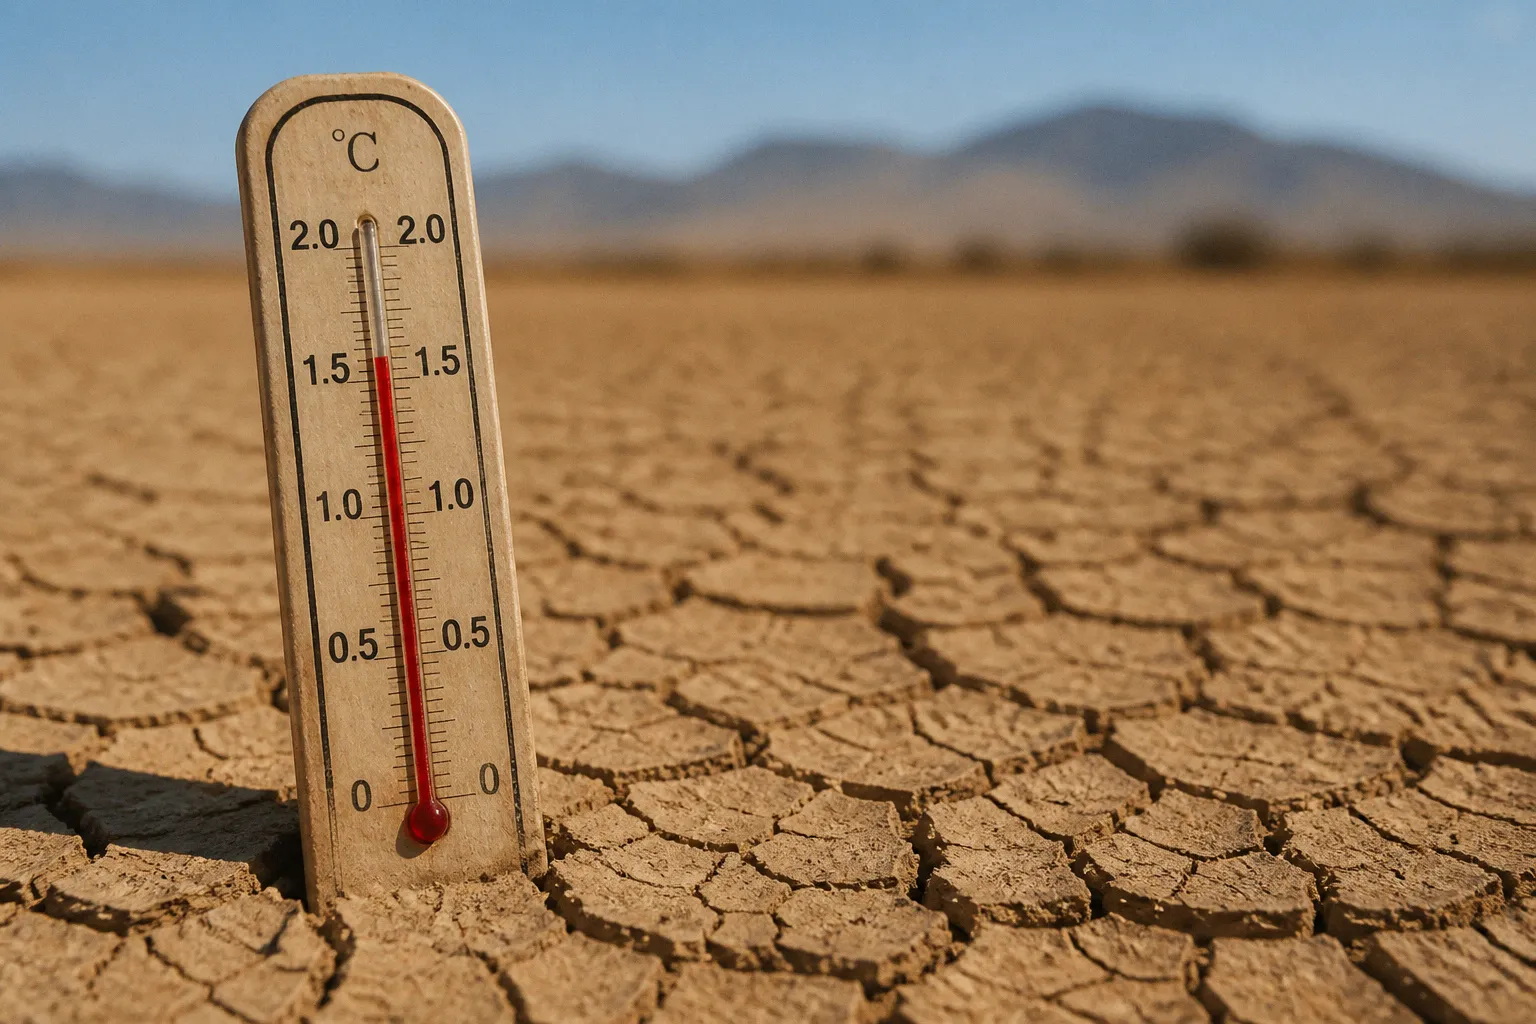
By the year's close, those reefs had endured sustained thermal stress well past the bleaching thresholds that define coral survival. The same year, climate agencies confirmed what the corals had already been signalling: 2024 finished at 1.55°C above the 1850–1900 pre-industrial baseline, the warmest calendar year in the instrumental record. Headlines carried the verdict — the Paris Agreement's 1.5°C limit, crossed. The underlying science, as it so often does, runs in a different current.
The dissonance matters. Annual records and rolling twelve-month streaks above 1.5°C are not the same event as a sustained crossing of the threshold the Paris Agreement actually defines. That limit is measured in decades, not seasons — and conflating the two has muddled public understanding of where the climate system sits, and how much room remains before the line is, in any formal sense, passed.
Defining the Threshold: Why 1.5°C Is a Multi-Decadal Metric
When negotiators in Paris in December 2015 wrote the 1.5°C target into the agreement, they were not describing a single year's anomaly. The threshold refers to long-term anthropogenic warming — the temperature signal produced by accumulated greenhouse gases — averaged over a 20- to 30-year period. That averaging window is deliberate. It filters out the noise of natural variability and isolates the signal of human-driven change.
The baseline itself is fixed at 1850–1900, the earliest interval with reliable global coverage of land and ocean temperature observations. Everything measured since is read against that pre-industrial reference. A year that lands at 1.55°C is therefore 1.55°C above the climate of the late nineteenth century — but it is not, by itself, evidence of a permanent breach.
The Paris threshold is not a line drawn on a thermometer. It is a statement about the climate system over decades, designed to capture sustained human influence rather than seasonal noise.
The choice of a multi-decadal window matters because the climate system wobbles. ENSO cycles — El Niño and La Niña phases — shift global mean temperature by roughly a tenth to two tenths of a degree from year to year, independent of any change in greenhouse gas concentrations. Volcanic eruptions inject reflective aerosols that cool the surface temporarily. Ocean heat content rebalances over multi-year timescales. A single year carries too much of this variability to serve as a verdict on long-term warming.
The 2024 Anomaly: Distinguishing Annual Spikes from Long-Term Warming
The numbers, taken at face value, look alarming. 2024 finished at approximately 1.55°C above the 1850–1900 baseline, the warmest calendar year ever measured. The preceding twelve-month period — February 2023 through January 2024 — was the first rolling year to exceed a 1.5°C average, reaching roughly 1.52°C according to Copernicus Climate Change Service analysis. Each month through much of 2023 and 2024 ran well above any previous observation in the modern record.
These figures are real and they are not statistical artefacts. But they describe the state of the climate over months and a single year, not over the multi-decadal window the Paris Agreement uses.
| Metric | Value | What it actually measures |
|---|---|---|
| 2024 calendar year anomaly | 1.55°C above 1850–1900 | Single warmest year on record |
| Feb 2023 – Jan 2024 anomaly | ~1.52°C | First 12-month period above 1.5°C |
| Long-term human-induced warming | 1.34°C – 1.41°C | 20- to 30-year averaged signal |
| Paris Agreement threshold | 1.5°C | Multi-decadal anthropogenic warming |
| Projected crossing window | Late 2020s – early 2030s | IPCC AR6 central estimate |
The distinction is technical but consequential. A sprint is not a marathon. If 2024 sits at 1.55°C but the underlying multi-decadal trend line is closer to 1.4°C, the planet is running ahead of schedule but has not yet, in the formal sense, reached the limit the treaty defines.
The Role of Natural Variability: El Niño and Short-Term Temperature Swings
No honest reading of the 2023–2024 record can ignore the El Niño event that developed across the eastern equatorial Pacific during 2023. El Niño redistributes heat from the deeper ocean, releasing warm water to the atmosphere and lifting global mean temperatures by an additional tenth of a degree or more. The 2023–2024 episode ranked among the five strongest on record, and its timing coincided almost exactly with the warmest year humanity has measured.
Strip the El Niño signal out and the underlying warming trajectory is steep but slightly lower than the headline figures suggest. This is not a dismissal — it is accounting. Climate scientists routinely present both the raw annual anomaly and the El Niño-adjusted trend precisely because the former is what people feel and the latter is what drives long-term change.
The same principle applies in reverse. A strong La Niña, or a large volcanic eruption like Pinatubo in 1991, can briefly mask the warming trend. The trend resumes. The signal accumulates. No single cool year reverses the underlying trajectory, just as no single hot year constitutes it.
An annual temperature record measures weather. A multi-decadal average measures climate. They respond to different forces on different timescales.
Current Climate Trajectory: Estimating the Real Human-Induced Warming Level
So where is the climate system, properly averaged? Recent assessments converge on a long-term human-induced warming level of approximately 1.34°C to 1.41°C above pre-industrial. That figure reflects the accumulated greenhouse gas signal — warming attributable to industrial emissions, land-use change, and shifts in atmospheric aerosols — integrated over decades.
This is the number that carries weight when scientists speak of remaining carbon budget, or time to threshold. It is the number that, at roughly 0.2°C of warming per decade under current trends, places a sustained 1.5°C crossing within the late 2020s or early 2030s under most IPCC AR6 scenarios.
The gap between this long-term figure and the 2024 calendar anomaly — roughly 0.15°C to 0.20°C — is itself instructive. It is the size of the natural variability envelope, the wiggle that El Niño and La Niña and ocean heat redistribution impose on top of the human signal. It is also a measure of how close the system is to the threshold in a more formal sense: one strong El Niño cycle stacked on top of a continued emissions trajectory could push the decadal average across 1.5°C sooner than the central projection suggests.
Beyond the Breach: Understanding the Continuous Nature of Climate Impacts
There is a persistent temptation, especially in political and media shorthand, to treat 1.5°C as a tripwire — a point at which climate damage suddenly begins. It is not. Climate impacts scale continuously with every fraction of a degree of warming. The thresholds that matter ecologically — sustained thermal stress on coral, the loss of late-summer Arctic sea ice, the dieback of Mediterranean pine forests, the desiccation of Sahel wetlands, the collapse of small mountain glaciers — do not wait for an official declaration.
Field observations already document what 1.3°C to 1.4°C of sustained warming looks like. Saltwater intrusion is reshaping estuaries along low-lying coasts, displacing salt-intolerant vegetation upstream and altering nursery habitat for migratory fish. Permafrost thaw is destabilising infrastructure across the Arctic and releasing ancient carbon that further accelerates the trend. Phenological mismatches — insects emerging before their host plants, migratory birds arriving after peak food availability — are propagating through temperate and boreal ecosystems. Species range contractions at trailing edges are outpacing expansions at leading edges, leaving net biodiversity loss in their wake.
In the mycelial networks beneath boreal forests, decomposition rates are accelerating as soil temperatures rise, releasing stored carbon faster than the canopy can recapture it. In the Mediterranean basin, keystone pine stands are dying in successive summers of compounded heat and drought, opening the way for fire-adapted shrub encroachment that further raises the probability of stand-replacing fires. On tropical reefs, the symbiosis between coral polyps and their zooxanthellae breaks down under thermal stress, bleaching the colony and, if prolonged, killing it outright.
Each additional tenth of a degree compresses the window in which ecological and human systems can adapt. The 1.5°C target was never a safe boundary; it was a best-case limit on additional warming, chosen because the risks above it escalate sharply. At 2°C, the IPCC AR6 estimates roughly twice as many people face water scarcity, warm-water coral reefs largely disappear as functional ecosystems, and the probability of triggering irreversible ice-sheet dynamics in Greenland and West Antarctica rises substantially.
A Threshold in Motion
The Paris Agreement's 1.5°C limit has not been formally breached — not yet, not by the definition that matters under international climate law. The long-term anthropogenic warming level sits closer to 1.4°C, and the multi-decadal crossing window, under most scenarios, falls in the late 2020s or early 2030s. The annual records of 2023 and 2024 are early signals, not verdicts. They tell us the trend is accelerating, the envelope is narrowing, and the margin between today's climate and the limit is shrinking faster than current emissions trajectories suggest.
The honest framing is not that we have crossed 1.5°C and failed, nor that we remain safely below it. It is that we are approaching it on a trajectory that bends only if the global emissions curve bends — and that every fraction of a degree avoided has measurable consequences for the ecosystems and communities already living with the warming we have produced. The reef does not wait for the decadal average to settle. Neither should the response.